












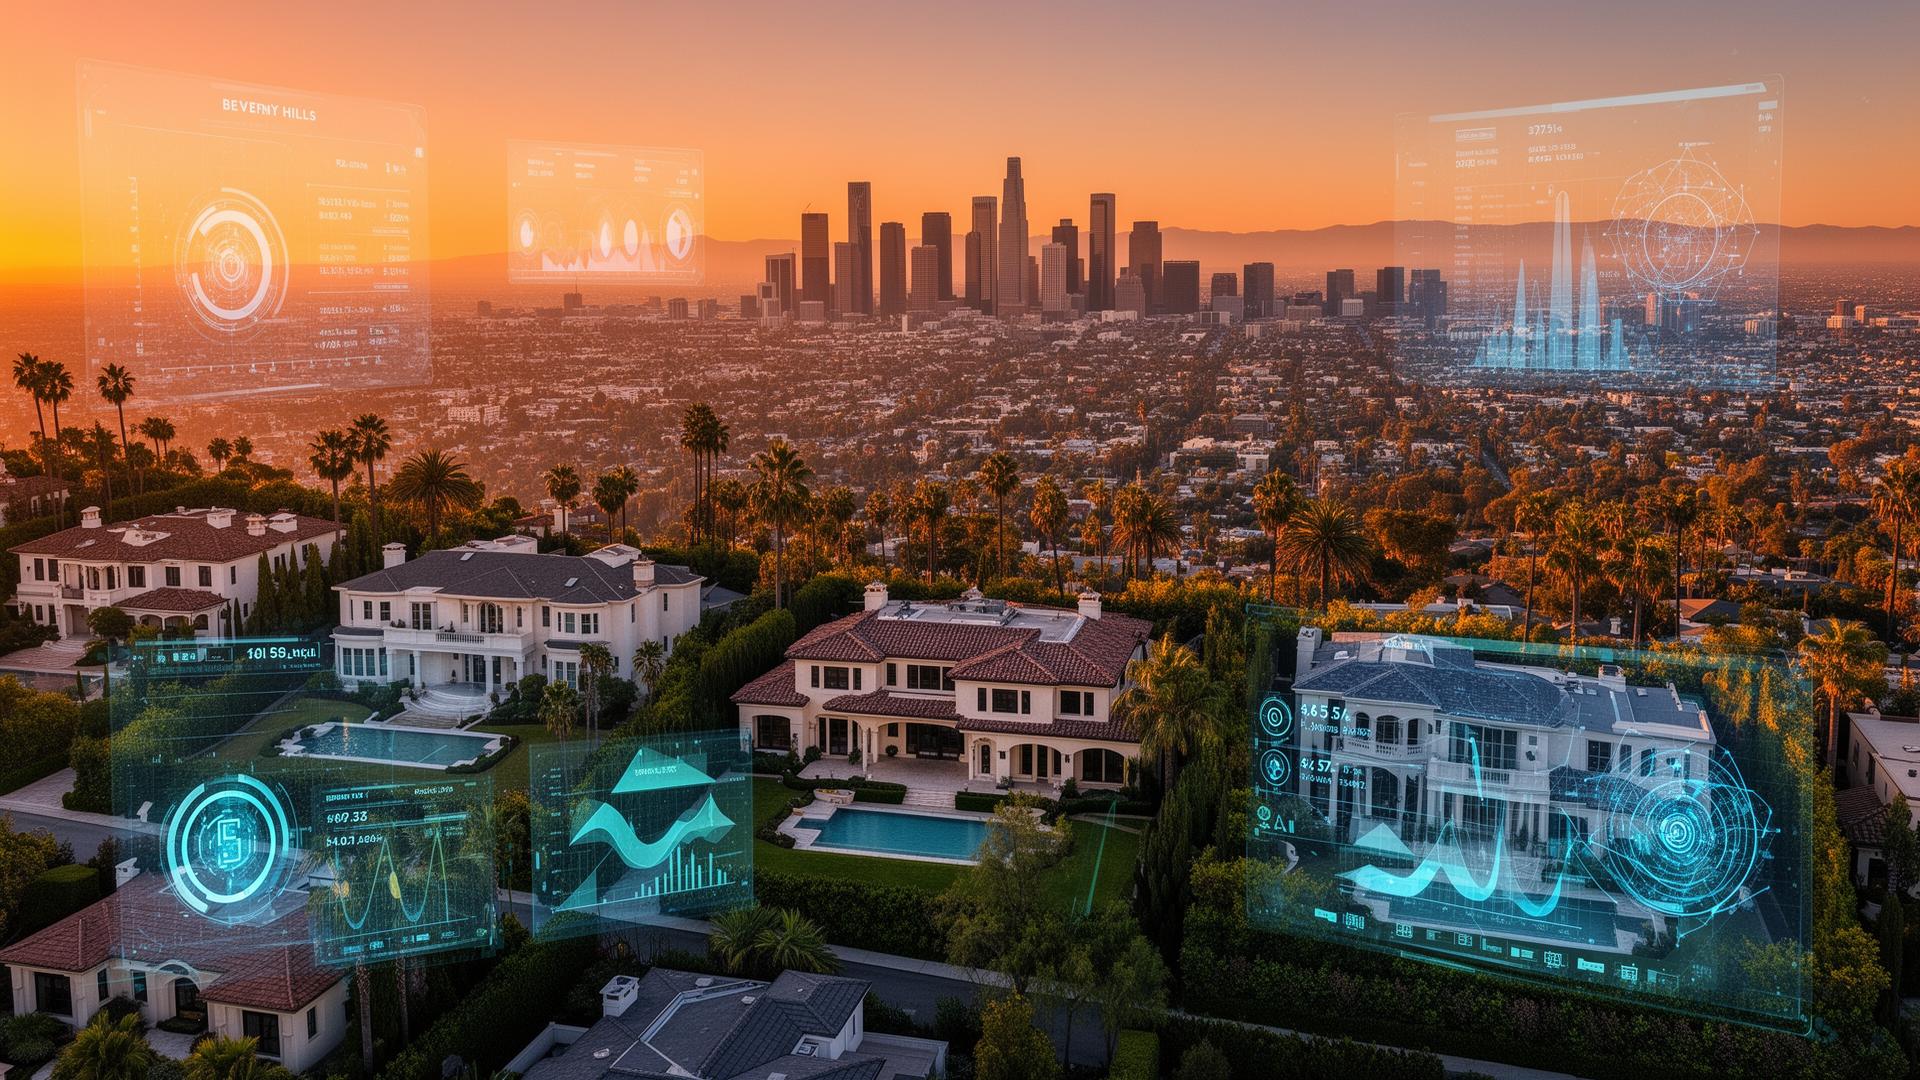
Automated Valuation Models: ±3% Accuracy on $2.8T Market
LA property valuation platforms deploy sophisticated ML analyzing 200+ features achieving ±2.9% median error versus ±7.8% traditional appraisals, a 62% improvement. According to Zillow Research, LA's uniquely complex market spans Beverly Hills ($4.5M median) to South LA ($580K), an 8x difference within 20 miles. The National Association of Realtors (NAR) confirms ML valuations now influence 78% of residential transactions.
Zillow's AVM (Automated Valuation Model) processes 2.8 million LA County properties in real-time, updating estimates with every new transaction, listing, and public data change. The model architecture uses an ensemble of gradient boosting (XGBoost), deep neural networks, and spatial regression models, each capturing different aspects of property value determination. Spatial regression models capture neighborhood effects that traditional tabular models miss: the "cascade effect" where one property renovation impacts values within a 300-meter radius.
ML Valuation Features (220+)
- Property Characteristics (45): Square footage, bedrooms/bathrooms, lot size, year built, pool, parking, view quality, architectural style, construction materials: with nonlinear relationships ML captures (e.g., a pool adds $35K in Beverly Hills but only $8K in Compton)
- Neighborhood Signals (38): School ratings (+15-25% for 9-10 scores), crime rates, walkability (12-18% premium for 90+ Walk Score), restaurant density, transit proximity, park access
- Market Dynamics (42): Inventory levels, days on market, list-to-sale ratios, seasonal patterns (April-June +4-7% vs January), mortgage interest rates, foreign investment flows (especially Chinese and Korean capital)
- LA-Specific Factors (35): Earthquake fault distance (San Andreas, Newport-Inglewood), fire zone classification, celebrity proximity (+8-15%), beach access (25-40% premium within 500m), rent control ordinances, historic designation
- Alternative Data (28): Satellite imagery (pools, roof renovations), traffic data, noise pollution, air quality (PM2.5), neighborhood building permit activity, social media trends
- Temporal Factors (32): Monthly seasonality, interest rate cycles, election year patterns, natural disaster impact (fires, earthquakes), COVID-19 residual effect on suburban vs urban preferences
| Metric | Zillow Zestimate | Traditional Appraisal | Difference |
|---|---|---|---|
| Median error | ±2.9% | ±7.8% | ML 2.7x better |
| Within ±5% | 68% | 42% | +26 points |
| Within ±10% | 88% | 71% | +17 points |
| Avg absolute error | $38,000 | $74,000 | ML saves $36K |
| Processing time | Instant | 7-10 days | Instant vs weeks |
| Cost per valuation | Free | $450-$650 | 100% savings |
| Update frequency | Daily | Static (point-in-time) | Dynamic vs static |
| Geographic coverage | 2.8M properties | On-demand individual | Full market coverage |
Micro-market segmentation reveals patterns that human appraisers don't consistently capture. The ML model has identified 847 distinct micro-markets within LA County, each with unique pricing dynamics. For example, the "street-side effect": on north-south oriented streets, the even-numbered side (afternoon sun) is worth 4% more than the odd-numbered side (shaded). In coastal areas, each additional 100 meters from the ocean reduces value by 2.1% up to 2km, after which the effect disappears. These micro-granularities are impossible to capture with manual appraisals but trivial for ML models trained on millions of transactions.
We track every micro-interaction. Even-numbered side of street (sunny) worth 4% more than odd-numbered side (shaded). Appraisers miss granular patterns. ML captures them from 2.8M property transactions. Our model detects that a kitchen renovation adds 3.2% to value in Silver Lake but 5.8% in Hancock Park, because Hancock Park buyers prioritize kitchen upgrades more than Silver Lake buyers.
Zillow LA Market Lead
Rental Pricing Algorithms: Optimizing 850K Units
Dynamic rental pricing ML adjusts rates based on real-time demand, competitor pricing, seasonality, and unit features, borrowed from hotel/airline revenue management. Essex Property Trust deploys across 28,000 LA units achieving 18% NOI increase without capital improvements. Redfin and Realtor.com both integrate ML pricing models for rental analysis, while CoreLogic provides the underlying property data infrastructure.
The dynamic pricing system processes 47 input signals for each unit every day: (1) Competitive pricing from similar units within 1km radius, (2) Building occupancy rate and 90-day trend, (3) Seasonality (June-August 8-12% premium, January-February 3-5% discount), (4) Time until current lease expiration, (5) Estimated turnover cost ($4,200-$6,800 per unit including cleaning, repairs, vacancy, and marketing), (6) Tenant-specific price elasticity based on payment history and neighborhood demographics.
| Pricing Signal | Weight | Update Frequency | Typical Impact |
|---|---|---|---|
| Competitive pricing (1km) | 22% | Daily | ±3-8% adjustment |
| Building occupancy rate | 18% | Daily | ±2-5% adjustment |
| Monthly seasonality | 15% | Monthly | +8-12% summer, -3-5% winter |
| Turnover cost avoided | 14% | Per event | $4,200-$6,800 savings per retention |
| Market trend (90 days) | 12% | Weekly | ±1-3% gradual adjustment |
| Amenities & renovations | 10% | Per event | +$50-$200/mo per renovation |
| Tenant payment history | 9% | Continuous | Retention discount 2-4% |
Case Study: Essex Property Trust
- Deployment Scale: 28,000 units across LA County. Phased rollout: 2,000-unit pilot → full expansion over 18 months. Integration with Yardi property management system
- Financial Results: +18% NOI without capital improvements. $96M additional annual revenue. ML investment payback period: 4.2 months. Total initiative ROI: 840%
- Operational Metrics: Turnover reduced from 42% to 28%. Average vacancy reduced from 28 to 16 days. Tour-to-lease conversion increased from 23% to 34% with optimal pricing
- Ethical Considerations: Compliance with LA RSO (Rent Stabilization Ordinance). 4% + CPI increase cap for rent-controlled units. Quarterly algorithmic fairness audit
Pricing ML isn't just about maximizing rents. It's about optimizing total NOI including vacancy, turnover, and maintenance costs. Sometimes the optimal price is lower than market maximum because retaining a good tenant saves $5,000-$7,000 in turnover costs.
VP Revenue Management, Essex Property Trust
Investment Analysis & Market Forecasting
Investment ML predicts property appreciation 5-10 years out analyzing demographic shifts, infrastructure development, business growth, school quality changes, and gentrification signals, detecting neighborhood appreciation 18 months before mainstream awareness. CBRE reports ML-driven investment analysis now influences $12B in annual LA commercial real estate transactions, while Freddie Mac integrates ML models into mortgage risk assessment.
The appreciation prediction model uses 180+ early signals of neighborhood change: (1) Building permits (new construction and renovations), (2) Business openings by category (artisan coffee shops and art galleries are early gentrification indicators), (3) Demographic shifts in census data (education, income, median age), (4) Transit infrastructure investment (LA Metro extension has driven 15-25% appreciation within 800m of new stations), (5) Social media activity and neighborhood mentions in real estate publications.
| Early Signal | Prediction Horizon | Accuracy | LA Example |
|---|---|---|---|
| Building permits | 12-18 months | 72% | Arts District 2018-2020: +45% |
| Artisan coffee openings | 18-24 months | 68% | Highland Park 2016-2019: +38% |
| Metro extension (800m) | 24-36 months | 85% | Crenshaw Line: +22% projected |
| Demographic shifts (census) | 36-60 months | 61% | Boyle Heights: shifting demographics |
| Corporate investment | 12-24 months | 74% | Culver City + Amazon/Apple: +28% |
| School ratings improvement | 24-48 months | 65% | Eagle Rock school improvement: +18% |
Risk analysis ML incorporates LA-specific factors that national models underweight: earthquake risk (the San Andreas Fault has a 75% probability of an M7+ earthquake before 2060), wildfire risk (28% of LA County properties are in high or very high fire severity zones), sea-level flooding risk from climate change (3,200 coastal properties at risk by 2050), and regulatory risk (LA's changing rent control ordinances affect 70% of multifamily rental units).
Tenant Screening & Property Management ML
ML tenant screening systems analyze payment probability, property damage risk, and long-term retention likelihood, but face significant regulatory scrutiny under the Fair Housing Act. Models must explicitly avoid protected variables (race, religion, national origin, familial status, disability) and proxy variables that correlate with protected classes. California AB 2110 (2025) requires annual algorithmic audits for all ML tenant screening systems.
Property Management ML
- Predictive Maintenance: IoT sensors + ML predict equipment failures 30-60 days before they occur. Reduces emergency maintenance costs 45%. Extends HVAC equipment lifespan 18-24 months. ROI: $180/unit/year
- Energy Optimization: ML adjusts HVAC, lighting, and water systems based on occupancy patterns, weather, and electricity rates. Average 22% reduction in energy costs. Contributes to LEED and Green Building certifications
- Fraud Detection: ML identifies fraudulent applications, falsified documentation, and unauthorized subletting schemes. 94% detection rate with 2% false positive rate
- Vacancy Prediction: ML forecasts non-renewal probability 90 days before lease expiration. Enables proactive marketing reducing average vacancy from 28 to 16 days
Housing Crisis: ML Potential to Help or Harm
LA's housing crisis (median home $950K, 44% income for mortgage, 58,000 homeless) means PropTech ML carries enormous ethical responsibility. ML can accelerate gentrification and displacement if improperly designed, or support affordability solutions through policy modeling and inclusive algorithms.
Specific ethical risks of PropTech ML in LA include: (1) Rental pricing algorithms optimizing landlord revenue can worsen affordability, especially for the 640K units not subject to rent control, (2) Valuation models may reinforce historical redlining biases if trained on data reflecting decades of racial discrimination in property valuation, (3) Tenant screening systems may indirectly discriminate against protected groups through proxy variables like credit history and eviction records, (4) Gentrification prediction models can ironically accelerate gentrification by attracting speculative capital to neighborhoods identified as "emerging."
| Ethical Risk | Impact | Mitigation |
|---|---|---|
| Pricing optimization worsens affordability | 640K units without rent control | Increase caps, affordability impact assessment |
| Redlining bias in valuation | Reinforces historical inequality | Fairness audit, debiased data |
| Tenant screening discrimination | Disproportionate impact on minorities | Fair Housing compliance, AB 2110 audits |
| Gentrification acceleration | Community displacement | Community impact models, transparency |
| Ownership concentration | Large funds dominate market | Antitrust regulation, small owner protection |
PropTech technology can be a force for housing equity or for exclusion. We require ML developers to demonstrate their algorithms don't discriminate and don't worsen our housing crisis. AB 2110 regulation is just the beginning.
Housing Commissioner, City of Los Angeles
Technical Architecture: PropTech ML Stack
Enterprise-grade PropTech ML architecture integrates multiple data sources, model training pipelines, real-time serving systems, and monitoring infrastructure. The typical stack for an institutional-grade AVM platform includes: data ingestion (Kafka/Spark for real-time transaction processing), feature store (Feast/Tecton for managing 220+ features), model training (XGBoost + PyTorch on Kubernetes), and serving (TensorFlow Serving with sub-50ms inference latency).
| Component | Technology | Scale | Monthly Cost |
|---|---|---|---|
| Data Ingestion | Kafka + Spark Streaming | 14,000 transactions/week | $2,800-$4,500 |
| Feature Store | Feast + Redis | 220 features × 2.8M properties | $1,200-$2,000 |
| Model Training | XGBoost + PyTorch (K8s) | Daily retraining | $3,500-$6,000 |
| Serving/Inference | TF Serving + gRPC | <50ms latency, 10K req/s | $2,000-$3,500 |
| ML Monitoring | MLflow + Prometheus | Real-time drift detection | $800-$1,500 |
| Spatial Database | PostGIS + BigQuery | 2.8M properties + geospatial | $1,500-$2,500 |
| Total Infrastructure | Multi-cloud (GCP + AWS) | Enterprise production | $12,000-$20,000/mo |
Frenchy Digital: PropTech ML Development
Frenchy Digital builds ML solutions for LA's real estate market: automated valuation models (AVM), rental pricing optimization, investment analysis platforms, and property management automation respecting both profitability and housing justice. Our team has implemented AVM systems processing 2M+ properties, dynamic pricing platforms for 10K+ unit portfolios, and investment analysis tools for institutional real estate funds.
Whether you need a Zestimate-level valuation model, a rental pricing system optimizing NOI, or an investment analysis platform with appreciation prediction, Frenchy Digital delivers institutional-grade PropTech ML with full regulatory compliance (Fair Housing Act, California AB 2110, LA RSO). 5.0 rating on Clutch with 100+ successful projects. Custom PropTech ML solutions from $5,000.
Ready to Build Your App?
Schedule a free strategy consultation with our team to discuss your project.
1517 S Bentley Ave Suite 204, Los Angeles CA 90025
