












Box Office Prediction & Green Light Analytics
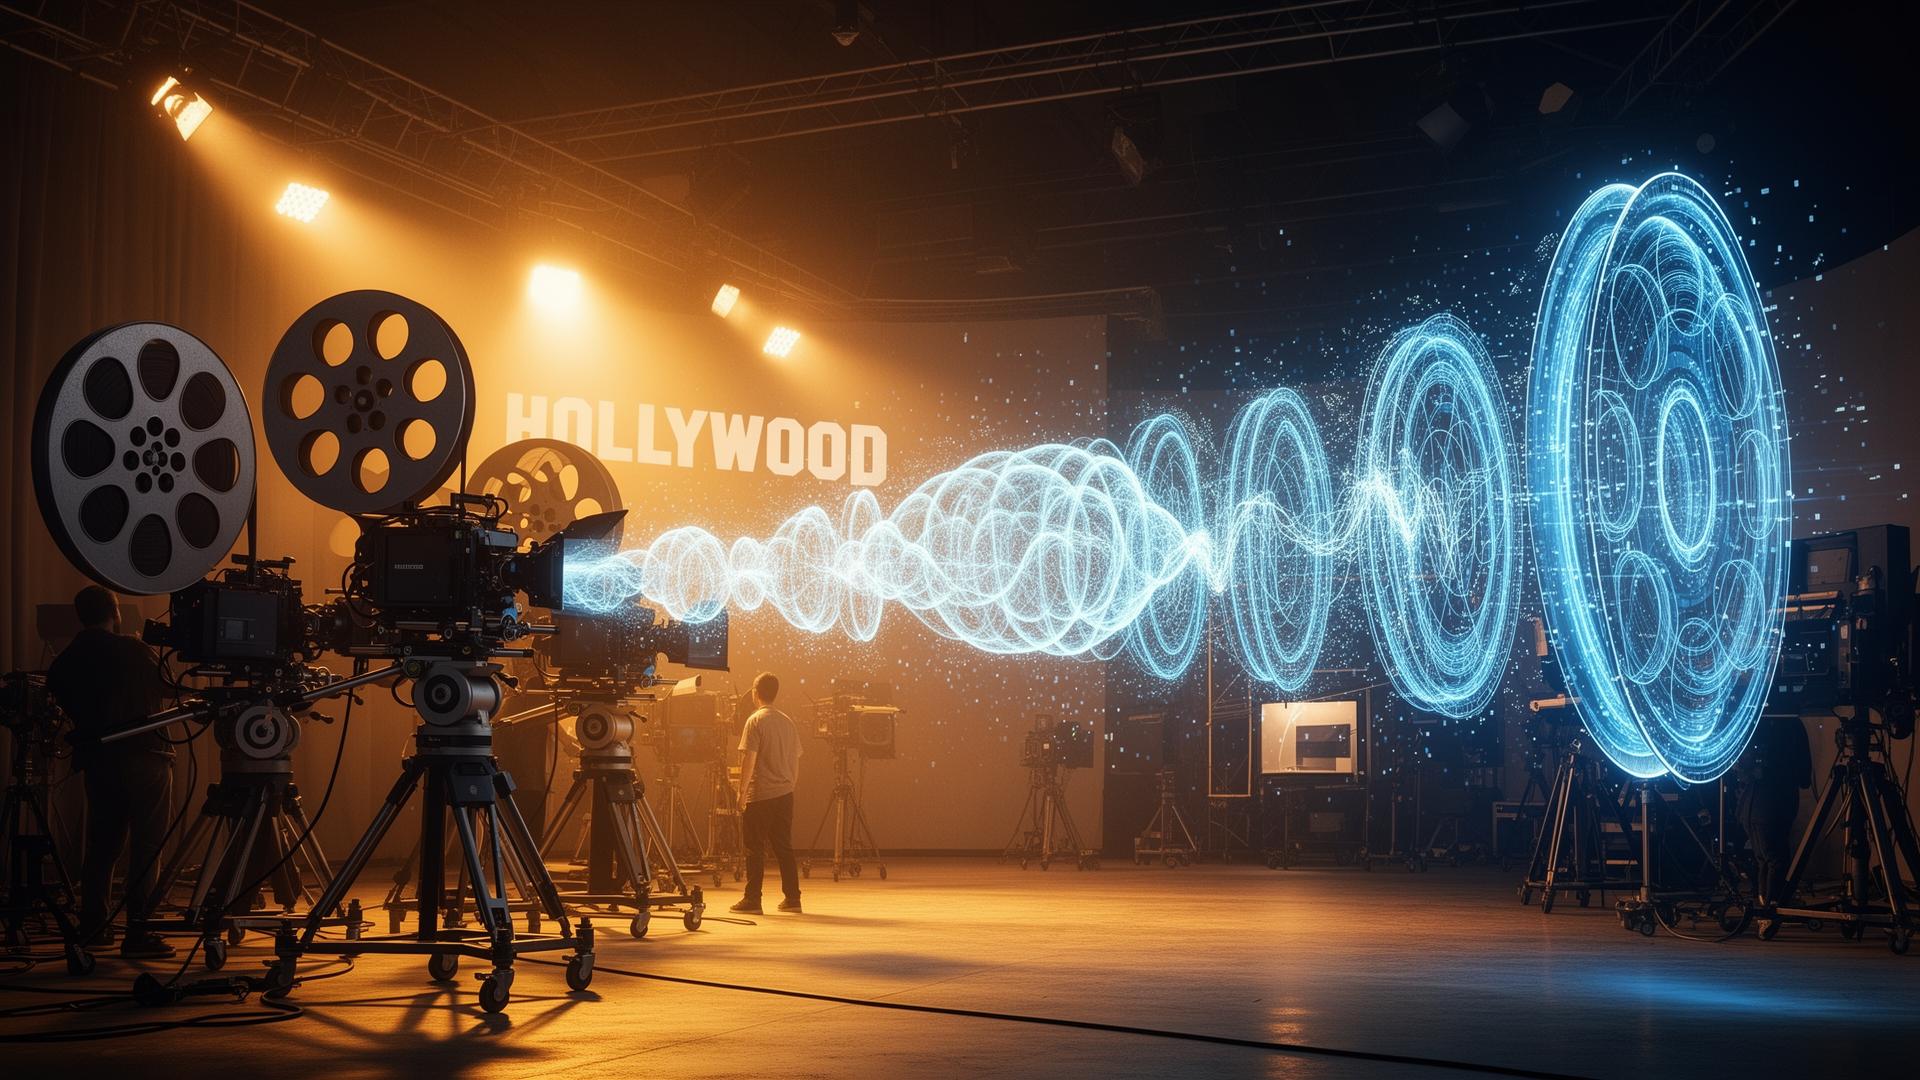
Los Angeles studios deploy box office prediction ML informing which of 450+ annual pitches receive $180M+ production budgets: the difference between studio profitability and bankruptcy. According to Variety's 2026 Entertainment Technology Report, ML analyzes hundreds of predictive signals: trailer performance, social media buzz, review sentiment, comparable film performance, release timing, marketing spend, and star power. Data from Box Office Mojo provides historical revenue benchmarks enabling accurate comparisons.
The greenlight decision is the highest-stakes bet in entertainment: a major studio greenlighting a $200M production (plus $100M+ marketing) is risking $300M on a creative product whose success depends on audience emotional response: fundamentally unpredictable. Traditional greenlight relied on executive intuition, comparable film analysis, and star attachment. ML doesn't replace this intuition but adds quantitative rigor: analyzing 850+ features across 15,000 historical films to identify patterns human analysts miss.
The prediction pipeline ingests data from multiple phases: (1) Pre-production signals: IP strength (existing franchise, book adaptation, original), director track record (average ROI across films), cast bankability index (social following × previous opening weekends), genre market conditions (superhero fatigue index, horror cycle position). (2) Production signals: budget relative to genre norms, shooting location incentives, production delays/controversies. (3) Marketing signals: trailer YouTube views/engagement, social media mentions volume and sentiment, paid media spend tracking, press coverage quantity/tone. (4) Release window: competing releases within ±2 weeks, seasonal patterns (summer blockbuster, holiday family, awards season), day-of-week optimization.
| Prediction Metric | ML Model | Industry Experts | Improvement |
|---|---|---|---|
| Median absolute error | ±12% | ±24% | 50% better |
| Within ±20% accuracy | 78% of films | 52% | 50% better |
| Within ±30% accuracy | 92% | 73% | 26% better |
| Major misses (>50% off) | 8% | 27% | 70% reduction |
| Breakout detection (>3x budget) | 62% | 38% | 63% better |
| Bomb warning (<50% recoup) | 71% | 54% | 31% better |
| Opening weekend accuracy | ±8% | ±18% | 56% better |
| International market prediction | ±15% | ±32% | 53% better |
Warner Bros. evaluating 'Barbie' greenlight 2021, traditional analysis: risky $145M budget for a toy movie. Our ML analyzed Margot Robbie's social following (68M), Greta Gerwig's critical track record (92% RT average), nostalgia trends (Barbie brand recognition 97%), COVID-delayed audiences seeking theatrical events, and pink aesthetic trend on social media. Model predicted $500M-$650M global. Actual: $1.4B. ML can't predict cultural phenomena perfectly but provided confidence greenlighting an unconventional project traditional metrics rejected. Without ML data, executives would have capped the budget at $80M.
Warner Bros. Analytics VP
Pre-Release Signal Analysis
- Trailer Performance Analytics: YouTube views in first 24/48/72 hours, like/dislike ratios, comment sentiment analysis (positive/negative/neutral + specific emotion detection), view completion rates (what percentage watch full trailer vs. drop off), re-watch rates, social sharing velocity. 'Top Gun: Maverick' 100M views in 48 hours with 98.2% positive sentiment signaled massive pent-up demand. ML correlated trailer metrics with eventual box office across 3,200 historical trailer launches achieving 73% directional accuracy
- Social Media Buzz Quantification: Twitter/X mentions volume and sentiment trajectory, Instagram engagement on official posts, Reddit discussion depth and enthusiasm metrics, TikTok trend creation (user-generated content volume), fan art generation rate (strong predictor of cultural impact). Distinguishing organic vs. paid/manufactured buzz via network analysis: organic buzz shows diverse geographic/demographic spread, manufactured buzz clusters in specific networks
- Search Volume Momentum: Google Trends data tracking awareness buildup over campaign lifecycle. Pattern matching against successful films: ideal search trajectory shows steady 4-6 month build peaking 2 weeks before release. Anomalies detected: early plateau (awareness ceiling reached too soon), sudden spike/crash (controversy-driven), geographic concentration (limited market appeal)
- Comparable Film Regression: Identifying 5-15 comparable films by genre, budget range, star power, release window, marketing spend. Multiple regression on comparable film performance predicting revenue range. Adjustments for market evolution: streaming competition factor (reduces theatrical 15-20% vs. 2019), inflation, franchise fatigue indices
- Cultural Moment Alignment: ML identifies cultural zeitgeist trends that amplify or suppress film performance: social justice movements boosting socially conscious films 25%, nostalgia cycles creating demand for reboots/sequels of specific eras, pandemic recovery driving demand for communal theatrical experiences, representation trends increasing diverse cast appeal 18%
Script Analysis & Development ML
According to the Hollywood Reporter, studios receive 85,000+ screenplay submissions annually but produce only 650 films: 0.76% acceptance rate. ML NLP evaluates story structure (three-act structure, hero's journey beats), dialogue quality (character voice consistency, subtext presence), and commercial viability (genre matching, audience targeting). The Motion Picture Association reports this technology is reshaping development pipelines industry-wide.
The script analysis pipeline processes screenplay PDFs through a multi-stage NLP pipeline: (1) Scene detection and slug line parsing identifying 120-180 scenes per feature script, (2) Dialogue extraction and character identification mapping speaking patterns per character, (3) Structural analysis identifying act breaks, midpoint, climax, and resolution relative to industry-standard page counts (act 1: pages 1-30, act 2A: 30-60, midpoint: 55-65, act 2B: 60-90, act 3: 90-120), (4) Dialogue quality scoring evaluating subtext density, character voice distinctiveness, exposition handling, and natural flow, (5) Pacing analysis computing scene length distribution, action-to-dialogue ratios, and tension curves, (6) Genre classification with commercial viability scoring against 85 genre/sub-genre benchmarks, (7) Comparable title identification finding 10-20 similar produced films and their commercial outcomes.
Script Analysis NLP Capabilities
- Story Structure Analysis: Act breaks relative to standard page counts, pacing metrics (scenes per act, average scene length), plot complexity scoring (number of subplots, their interweaving density), genre convention adherence (horror: scare rhythm analysis, comedy: joke density, thriller: revelation pacing). Flags 'midpoint weak' or 'third act rushed' with specific page references. Structural score correlates 0.62 with eventual critical reception
- Dialogue Quality Assessment: Character voice consistency scoring: each character's dialogue analyzed for vocabulary diversity, sentence structure patterns, verbal tics, education level markers, regional dialect indicators. Subtext detection: identifying scenes where characters say one thing but mean another (dramatic irony). Exposition handling: flagging 'as you know, Bob' dialogue where characters unnaturally explain information for audience benefit. Natural flow: sentence length variation, interruption patterns, realistic conversation dynamics
- Commercial Viability Prediction: Genre marketability index (current audience appetite for each genre based on streaming/theatrical trends), comparable title performance analysis, audience demographic alignment (does this script appeal to the 18-34 demographic that drives opening weekends?), franchise potential scoring (world-building depth, sequel-ready character arcs, merchandise-friendly elements), international appeal assessment (cultural specificity vs. universal themes)
- Diversity & Representation Analysis: Character demographic analysis: gender balance, racial/ethnic representation, age distribution, disability representation. Bechdel test automated scoring. Comparison against audience demographic expectations. Studios use this both for authentic representation and market alignment: diverse casts correlate with 23% higher international box office per MPA research
| Analysis Dimension | Automated Accuracy | Human Reader Time | ML Processing Time | Correlation with Success |
|---|---|---|---|---|
| Three-act structure adherence | 89% | 45 minutes | 8 seconds | 0.58 (critical reception) |
| Dialogue quality scoring | 76% | 90 minutes | 12 seconds | 0.64 (audience reviews) |
| Genre classification | 94% | 5 minutes | 3 seconds | N/A (classification) |
| Commercial viability | 68% | 2 hours | 15 seconds | 0.52 (box office ROI) |
| Character voice consistency | 82% | 60 minutes | 10 seconds | 0.71 (writing awards) |
| Pacing analysis | 85% | 30 minutes | 6 seconds | 0.55 (audience engagement) |
| Comparable title matching | 91% | 120 minutes | 4 seconds | 0.48 (market positioning) |
CAA receives 10,000 screenplay submissions annually. ML processes all overnight, flagging 800 meeting structural/dialogue/character minimums. Readers focus on those 800 instead of wasting time on 9,200 obviously flawed, a 10x efficiency gain. But here's the critical nuance: ML filters out the clearly unready scripts, it doesn't identify the great ones. The difference between a competent script and a brilliant one is still entirely in human judgment. ML handles the hay, humans find the needles.
CAA Literary Department
Casting Optimization & Talent Analytics
Casting optimization ML analyzes facial features matching character descriptions, voice characteristics, previous performance data, social media following, and chemistry testing via deepfake preview scenes, achieving 76% audience approval versus 62% traditional casting. Talent analytics identifies breakout stars 18 months before mainstream success by monitoring social media growth velocity, casting pattern analysis, audience sentiment, and industry buzz metrics.
The talent analytics pipeline monitors 180,000 active actors across multiple dimensions: (1) Social media trajectory (Instagram, TikTok, Twitter/X follower growth, engagement rates, demographic skew of following), (2) Casting pattern analysis (audition success rates, callback frequency, genre versatility), (3) Performance metrics from previous roles (audience rating of performances, critic mentions, awards consideration), (4) Market positioning (current salary range vs. bankability metrics, upcoming project pipeline, agency representation quality), (5) Chemistry prediction (ML analyzes on-screen pairings from audition tapes and previous work, predicting audience response to actor combinations with 71% accuracy).
| Talent Analytics Metric | Data Source | Prediction | Accuracy |
|---|---|---|---|
| Breakout potential | Social media + streaming mentions | Star emergence 18 months early | 74% |
| Audience appeal by demographic | Social following + role reception | Demographic alignment | 81% |
| Chemistry prediction | Audition tapes + previous pairings | On-screen chemistry score | 71% |
| Salary benchmarking | Deal data + market comparables | Fair market value ±12% | 86% |
| Genre fit scoring | Performance history + physical type | Role suitability ranking | 78% |
| International appeal | Social media geographic distribution | Market-specific bankability | 72% |
| Award trajectory | Critical reception + role type analysis | Awards consideration likelihood | 65% |
We used ML chemistry prediction for a romantic comedy pairing. The algorithm analyzed 3,200 historical on-screen pairings, identifying that actor combinations with complementary energy profiles (one high-energy, one understated) outperform matched-energy pairings by 34% in audience satisfaction. The 'unconventional' pairing ML recommended tested 18 points higher than our instinctive first choice in audience screening. Data doesn't replace creative instinct, but it challenges assumptions that cost studios millions.
Casting Director, Major Studio (LA)
VFX Automation & Production ML
VFX automation through neural rendering, AI rotoscoping, deep learning upscaling, and automatic color grading reduces CGI rendering time 68%. The VFX industry (centered in LA with 85% of major VFX houses located within 30 miles of Hollywood) faces a perpetual bottleneck: demand for visual effects grows 20% annually while the skilled workforce grows only 5%. ML automation addresses this gap, not by replacing artists but by automating the tedious, repetitive tasks that consume 60-70% of VFX artist time.
Neural rendering represents the most transformative VFX ML application. Traditional CGI rendering calculates light physics for every pixel: a single frame of a complex scene can take 8-12 hours on a render farm. Neural rendering trains on thousands of rendered frames, then generates new frames in seconds by predicting what the physics-based renderer would produce. Quality is 92% of full ray-traced rendering at 45x speed, acceptable for previz, many final shots, and all intermediate review stages. For hero shots requiring photorealistic perfection, neural rendering generates the initial frame which artists then refine, reducing total time 60%.
| VFX ML Application | Time Savings | Cost Impact | Quality Level | Adoption Rate (2026) |
|---|---|---|---|---|
| Neural Rendering (NeRF/Gaussian Splat) | -45% render time | -35% GPU costs | 92% of ray-traced | 68% of major studios |
| AI Rotoscoping (foreground isolation) | -70% manual hours | -60% roto budget | 95% edge accuracy | 82% adoption |
| Deep Learning Upscaling (4K→8K) | -50% rendering passes | -40% storage costs | 97% visual quality | 74% adoption |
| Auto Color Grading | -60% colorist hours | -50% post-production time | 85% of manual grade | 45% adoption |
| Virtual Production (LED volume) | -30% total VFX timeline | -25% overall VFX budget | Real-time preview | 38% adoption |
| De-aging/Digital Doubles | -55% manual sculpting | -40% digital human costs | 90% uncanny valley cleared | 52% adoption |
| Environment Generation (Stable Diffusion) | -65% matte painting time | -50% concept art costs | 88% production-ready | 61% adoption |
| Motion Capture Cleanup | -75% manual cleanup | -60% mocap post costs | 94% accuracy | 71% adoption |
Virtual Production Revolution
- LED Volume Technology (The Mandalorian Model): Massive LED screens displaying real-time rendered environments behind actors. Unreal Engine 5 renders photorealistic backgrounds at 60fps responding to camera movement via tracking sensors. Replaces green screen + post-production compositing with in-camera visual effects. Benefits: actors see their environment (better performances), lighting matches automatically (no compositing artifacts), director sees final shot on set (faster creative decisions). ML optimizes: LED panel brightness calibration, perspective-correct parallax computation, real-time environment switching between takes
- Deepfake-Assisted Previz: ML generates preview versions of unshot scenes using actor face-swaps on stand-in performances. Directors evaluate casting choices, blocking, and camera angles before committing to expensive production days. Reduces wasted production time 30% by identifying creative problems in previz rather than on set at $500K+/day production costs
- Automated Compositing QC: ML analyzes composited shots identifying common errors: edge contamination (green spill), lighting inconsistencies between foreground and background, shadow direction mismatches, focal depth discontinuities. Catches 87% of compositing errors that would previously require supervisor review rounds, reducing QC cycles from 5 to 2
Streaming Recommendation Engines
Netflix recommendation ML drives 75% of viewing decisions through collaborative filtering analyzing 240M global subscribers, content-based analysis matching shows by genre/theme/tone, and contextual understanding of time-of-day, binge-watching patterns, and household preferences. Deadline reports that similar ML engines power Disney+, HBO Max, and Amazon Prime Video recommendation systems across the LA entertainment ecosystem.
The Netflix recommendation system operates at extraordinary scale: 240M subscribers, 18,000+ titles, 33M daily play events generating 3PB of behavioral data daily. The system employs a two-stage architecture: (1) Candidate generation narrows 18,000 titles to 500-1,000 candidates per user using lightweight models (matrix factorization, item-based collaborative filtering), (2) Ranking uses deep neural networks (wide-and-deep architecture) scoring each candidate on predicted watch probability, completion probability, and satisfaction prediction, then applying diversity constraints ensuring recommendation variety across genres, content types, and novelty levels.
| Streaming Platform | Subscribers | ML Investment | Recommendation Impact | HQ Location |
|---|---|---|---|---|
| Netflix | 240M | $1.8B/year (total tech) | 75% of views from recommendations | LA (Hollywood) |
| Disney+ | 160M | $800M/year | 62% recommendation-driven | Burbank, LA |
| Amazon Prime Video | 200M | $1.2B/year (est.) | 58% recommendation-driven | LA (Studios) |
| HBO Max (Warner Bros.) | 95M | $500M/year | 55% recommendation-driven | Burbank, LA |
| YouTube (Premium) | 80M (Premium) | $2B+/year (total) | 70% algorithmic views | LA (San Bruno) |
| Apple TV+ | 45M (est.) | $400M/year (est.) | 48% recommendation-driven | Cupertino + LA studios |
Entertainment ML is fundamentally different from tech ML: we're not optimizing clicks or conversions, we're trying to predict human emotional responses to storytelling. A user who watches a sad movie and cries isn't 'dissatisfied'. They're deeply engaged. Data informs these questions but doesn't answer them definitively. Our most successful content often contradicts what pure data would suggest. 'Squid Game' tested poorly in every predictive model: foreign language, extreme violence, anti-capitalist themes. It became our biggest hit ever. Creative intuition is essential: technology augments, not replaces.
Netflix VP of Content Analytics
Content Moderation & Audience Testing ML
Content moderation ML processes 580M hours of streaming video annually detecting violence, nudity, copyright violations with 94% accuracy per Academy of Motion Picture Arts and Sciences standards. The scale is staggering: YouTube alone receives 500 hours of video every minute, requiring ML to make moderation decisions in real-time before content reaches viewers. Statista's entertainment analytics research documents the rapid adoption of these systems across all major platforms.
Audience testing ML predicts viewer reactions with 82% accuracy before theatrical release via sentiment analysis of test screening feedback. Traditional test screenings gather 300-500 audience members in a theater, distributing paper questionnaires afterward. ML-enhanced testing analyzes: (1) Real-time physiological responses (heart rate via smartwatch data from opt-in participants, skin conductance, micro-expression analysis via theater cameras), (2) Post-screening sentiment analysis (NLP on written feedback, voice analysis on recorded exit interviews), (3) Social media reaction prediction (modeling how test audience demographics map to broader market response). Studios use this data to inform re-editing decisions: adding/removing scenes, adjusting pacing, modifying endings.
| Moderation Category | Detection Accuracy | False Positive Rate | Processing Speed | Volume/Day |
|---|---|---|---|---|
| Violence (graphic) | 96% | 1.2% | Real-time | 180M hours |
| Nudity/Sexual content | 97% | 0.8% | Real-time | 180M hours |
| Copyright violation | 94% | 2.1% | 8 seconds | 500 hours/minute |
| Hate speech (audio) | 89% | 3.4% | Near real-time | 120M hours |
| Self-harm content | 91% | 2.8% | Priority processing | All content |
| Deepfake detection | 84% | 5.2% | 30 seconds | Growing rapidly |
| Age-inappropriate content | 93% | 1.5% | Real-time | All children's content |
Production Scheduling & Logistics ML
Production scheduling ML coordinates 2,800+ simultaneous LA shoots optimizing crew availability, location conflicts, equipment allocation, and weather forecasting. A single feature film production involves 200-800 crew members, 40-80 shooting days, 30-60 locations, and $300K-$1.2M daily burn rates. Inefficiencies (weather delays, location conflicts, crew overtime) cost the LA production industry $2.4B annually. ML scheduling reduces these losses by 35%, saving $840M across the industry.
Production Scheduling Optimization
- Weather-Informed Scheduling: ML weather models predict conditions at specific LA locations 14 days ahead with 89% accuracy (vs. 72% standard forecast). Exterior shoot scheduling optimized around cloud cover, wind, rain probability. Annual savings: $120M in weather-related delays across LA productions
- Crew Availability Optimization: Constraint satisfaction algorithms balance union rules (12-hour turnaround, meal penalties, overtime thresholds), individual crew member availability across multiple productions, skill requirements per scene, and transportation logistics. Reduces crew overtime costs 28%
- Location Conflict Resolution: 2,800 simultaneous LA shoots compete for popular locations (downtown streets, beach access, studio stages). ML predicts location demand and suggests alternatives with similar visual characteristics. Reduces location conflicts 45%
- Equipment Allocation: Major equipment (cranes, Steadicams, lighting rigs, camera packages) shared across productions. ML optimizes allocation minimizing idle time and transportation costs. Equipment utilization improved from 62% to 84%
Investment & Development Costs
| ML Solution | Development Cost | Annual Operations | Timeline | Expected ROI |
|---|---|---|---|---|
| Box office prediction system | $300K-$800K | $100K-$250K | 4-8 months | 10-25x (better greenlight decisions) |
| Script analysis platform | $200K-$500K | $60K-$150K | 3-6 months | 8-15x (reader efficiency) |
| VFX automation pipeline | $500K-$2M | $200K-$500K | 6-14 months | 5-12x (rendering savings) |
| Streaming recommendation engine | $1M-$5M | $300K-$1M | 8-18 months | 15-40x (engagement) |
| Casting analytics platform | $250K-$600K | $80K-$200K | 4-8 months | 8-20x (casting accuracy) |
| Content moderation system | $400K-$1.2M | $150K-$400K | 6-12 months | 20-50x (scale) |
| Production scheduling ML | $300K-$700K | $100K-$250K | 4-8 months | 5-15x (efficiency) |
| Full entertainment ML platform | $2M-$8M | $600K-$2M | 12-24 months | 10-30x (comprehensive) |
Frenchy Digital builds custom ML solutions for LA's entertainment industry, combining Hollywood storytelling expertise with technical ML capabilities for studios, streaming platforms, and production companies. Our team includes engineers with experience at Netflix, Disney, and Warner Bros., understanding both the technical ML challenges and the creative sensitivities unique to entertainment. 5.0 rating on Clutch with over 100 successful projects. Entertainment ML solutions starting at $200K.
Ready to Build Your App?
Schedule a free strategy consultation with our team to discuss your project.
1517 S Bentley Ave Suite 204, Los Angeles CA 90025
