












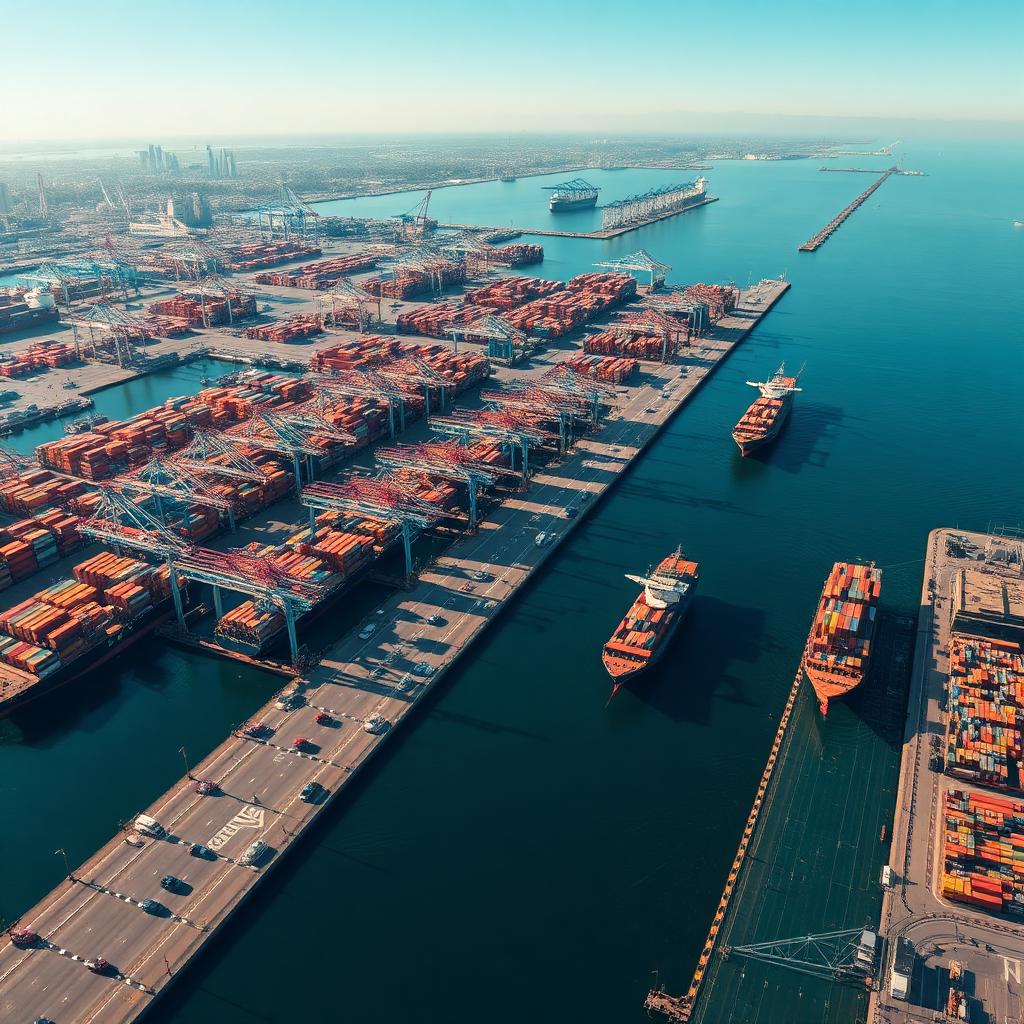
Why LA Logistics Is Uniquely Challenging
Los Angeles presents the most complex logistics environment in North America: worst traffic congestion (119 hours/year stuck per driver costing $2,800), massive geographic sprawl (5,000 square miles versus NYC's 300), port-centric economy (30% of jobs directly/indirectly port-related), and strict air quality regulations restricting diesel trucks.
The ecosystem spans Port of LA (largest container port in the Western Hemisphere handling 9.5M TEU annually, 43% of US imports), logistics companies (UPS, FedEx, Amazon operating 2,800+ facilities LA region), autonomous vehicle developers (Waymo, Cruise, Aurora testing 4,800 miles daily), trucking companies (120,000 trucks serving port complex), supply chain platforms (Flexport, project44, FourKites tracking $280B annual cargo), last-mile delivery services (Postmates, DoorDash, Uber Eats covering 5,000 square miles), fleet management companies optimizing 285K commercial vehicles, and warehouse operators (Prologis, CBRE managing 850M sqft industrial space).
| Challenge | LA Metric | National Average | Complexity Factor |
|---|---|---|---|
| Traffic Congestion | 119 hrs/yr stuck | 54 hrs/yr | 2.2x more congested |
| Geographic Sprawl | 5,000 sq miles | 300 sq miles (NYC) | 16.7x larger delivery area |
| Port Volume | 9.5M TEU/year | 1.2M average US port | 7.9x more cargo |
| Truck Fleet | 120,000 trucks | Port average 15K | 8x larger fleet |
| Air Quality Regulation | SCAQMD strictest US | EPA baseline | 2-3x stricter emissions |
| Seismic Risk | Major earthquake zone | Low risk most cities | Unique infrastructure needs |
| Population Density | 8,300/sq mile urban | 1,600/sq mile US avg | 5.2x denser delivery area |
| Warehouse Space | 850M sqft | 120M sqft avg metro | 7.1x more warehouse operations |
According to FreightWaves' 2026 Transportation AI Survey polling 680 logistics executives: 78% now using ML for route optimization/demand forecasting/fleet management (up from 22% in 2019), 84% reporting ML improving operational efficiency 25-45%, 72% citing driver shortage as primary motivator for automation, and 96% believing AI will transform logistics next decade.
LA logistics uniquely challenging: port bottlenecks, notorious traffic, sprawling geography, strict emissions regulations, seismic risks. Generic ML designed for Manhattan fails spectacularly here. NYC: compact, subway-based, walking-friendly, consistent grid. LA: car-dependent, freeway-centric, fragmented infrastructure, unpredictable congestion. We need algorithms understanding LA's chaos: that requires LA-based developers living this reality daily.
Port of LA Innovation Director
LA Transportation ML Investment by Segment (2025)
| Segment | Investment | Companies | Growth YoY |
|---|---|---|---|
| Port Operations | $1.8B | 42 | +34% |
| Last-Mile Delivery | $1.4B | 85 | +48% |
| Autonomous Vehicles | $1.2B | 28 | +62% |
| Supply Chain Platforms | $980M | 45 | +38% |
| Fleet Management | $860M | 120 | +28% |
| Warehouse Automation | $720M | 65 | +52% |
| Freight Matching | $680M | 35 | +44% |
| Cold Chain & Specialty | $480M | 22 | +36% |
| Traffic & Infrastructure | $280M | 18 | +22% |
Port Operations & Berth Allocation ML
Port of Los Angeles, the largest container port in the Western Hemisphere handling 9.5M TEU annually (43% of US imports), deploys ML for berth allocation reducing ship wait times from 4.2 days to 1.8 days, saving the shipping industry $768M annually.
Berth Allocation Optimization
- Challenge: 43 berths across 25 terminals accommodating 1,200+ foot vessels. Traditional first-come-first-served creating inefficiencies: small ships occupying large berths, mismatched terminal capabilities, unnecessary vessel anchoring
- ML Solution: Predictive arrival times (AIS vessel tracking, weather forecasts, port congestion, 6-12 hours ahead with 94% accuracy), dynamic berth assignment matching vessel size/cargo/crane availability, terminal load balancing preventing congestion
- Results: Wait time: 4.2 days → 1.8 days (58% reduction). Container handling per ship hour: +22%. Berth utilization: 62% → 78%. Turnaround time prediction enabling better scheduling
- Economic Impact: Each day vessel waits costs $75K-$150K (crew, fuel, opportunity cost, penalties). 2.4 days × 3,200 annual vessel calls × $100K = $768M industry savings
| Port Metric | Before ML (2019) | After ML (2025) | Impact |
|---|---|---|---|
| Average Ship Wait | 4.2 days | 1.8 days | 58% reduction |
| Berth Utilization | 62% | 78% | 26% improvement |
| Container Moves/Hour | 28 | 34.2 | 22% faster |
| Vessel Turnaround | 4.8 days | 3.2 days | 33% faster |
| Crane Assignment Efficiency | 72% | 91% | 26% improvement |
| Annual Industry Savings | N/A | $768M | Reduced waiting costs |
| Terminal Throughput | 7.2M TEU | 9.5M TEU | 32% increase (same infrastructure) |
| Vessel Schedule Prediction | ±18 hours | ±4 hours | 78% more accurate |
Crane Assignment & Terminal Operations
- Dynamic Crane Allocation: ML analyzing vessel cargo manifest, container weight distribution, and discharge sequence to optimally assign 4-8 gantry cranes per vessel, maximizing container moves per hour while minimizing crane repositioning
- Gang Scheduling: Coordinating longshoreman crews across 25 terminals based on predicted vessel arrivals, cargo volumes, and shift availability, reducing labor idle time 28%
- Truck Appointment System: ML scheduling 12,000 daily truck appointments at port terminals, minimizing gate congestion. Average truck turn time reduced from 82 to 48 minutes, reducing emissions from idling diesel trucks
- Vessel Stowage Planning: Optimizing container placement on ships for efficient discharge at destination ports, considering weight distribution, hazmat segregation, and port-of-call sequence
2021 supply chain crisis saw 100+ ships anchored offshore waiting weeks. We deployed ML berth allocation: analyzing real-time arrivals, cargo backlogs, terminal capacity. Wait times dropped 58%. No more floating parking lot offshore costing millions daily. ML transformed our port from crisis-mode to predictive-mode: we anticipate bottlenecks before they form.
Port of LA Operations Director
Container Yard Management ML
Port yards storing 50,000+ containers with ML reducing rehandles from 1.8 to 0.6 per container (67% improvement), saving $740M annually through predictive stacking and automated crane choreography.
Container Yard Optimization
- Problem: 50,000+ containers stored. Traditional stacking: 1.8 rehandles per container (reshuffles costing time/equipment/labor). Manual planning impossible, like a constantly changing 50,000-piece puzzle
- Predictive Stacking: Analyzing pickup patterns, destination clustering, dwell time forecasts, placing frequently-accessed containers on top/edges. Dynamic restacking for near-term pickups
- Equipment Utilization: Optimizing crane movements minimizing travel distances and energy consumption. Automated crane choreography retrieving containers 38% faster
- Results: Rehandles: 1.8 → 0.6 per container (67%). Retrieval time: -38%. Equipment productivity: +28%. Cost: 9.5M TEU × 1.2 rehandles saved × $65 = $740M annually
| Yard Metric | Before ML | After ML | Improvement |
|---|---|---|---|
| Rehandles Per Container | 1.8 | 0.6 | 67% reduction |
| Container Retrieval Time | 18 minutes | 11 minutes | 38% faster |
| Equipment Productivity | Baseline | +28% | Less travel, more moves |
| Yard Capacity (Effective) | 42,000 TEU | 58,000 TEU | 38% more capacity |
| Dwell Time Prediction | ±3 days | ±0.8 days | 73% more accurate |
| Energy Consumption | Baseline | -22% | Optimized crane movements |
| Labor Productivity | Baseline | +34% | Less reshuffling work |
| Annual Cost Savings | N/A | $740M | Across all LA terminals |
ML-powered container yard management transforms the port's most labor-intensive operation. Traditional container stacking is essentially guesswork: operators stack containers where space is available without knowing when each will be retrieved. ML predicts container pickup times with ±0.8 day accuracy (vs ±3 days traditional), enabling strategic placement that minimizes the costly reshuffling of 40-ton steel boxes using $4M gantry cranes.
Rail Intermodal & Port-to-Warehouse ML
ML coordinates container transfers between port terminals and BNSF/Union Pacific rail yards, reducing truck drayage 34%, optimizing rail car loading to 94% capacity utilization, and reducing transit time from 6.2 to 4.1 days for LA-to-Chicago shipments.
Rail Intermodal Optimization
- Port-to-Rail Transfer: ML coordinating container movement from port terminals to on-dock and near-dock rail yards, scheduling transfers to minimize truck drayage trips on congested I-710 corridor
- Rail Car Loading: Optimizing container placement on rail cars considering weight limits, double-stack compatibility, and destination sequencing, improving capacity utilization from 78% to 94%
- Train Scheduling: Dynamic scheduling 8-12 daily intermodal trains based on container availability, destination demand, and network capacity, reducing dwell time at rail yards 42%
- Transit Time Optimization: ML selecting optimal routes and interchange points across BNSF and Union Pacific networks, LA-to-Chicago reduced from 6.2 to 4.1 days through better network utilization
- Truck Drayage Reduction: Increasing on-dock rail usage from 22% to 34% of containers, reducing 4,200 daily truck trips on I-710 (Southern California's most congested freight corridor)
The Alameda Corridor, the dedicated 20-mile freight rail expressway connecting the Port of LA to the transcontinental rail network, handles 68 trains daily. ML optimizes train scheduling, track utilization, and intersection management reducing corridor transit time 28% and enabling 12% more daily trains without infrastructure expansion.
Rail is the most efficient mode for long-haul: one train replaces 280 trucks. ML optimizes the entire intermodal chain: container dwell at port, truck drayage to rail yard, train loading, route selection, destination delivery. Our LA-to-Chicago transit time dropped from 6.2 to 4.1 days. Shippers get reliability comparable to trucking at 60% lower cost and 75% lower emissions.
BNSF Railway Innovation Director, LA Operations
Supply Chain Prediction & Disruption Detection
ML forecasting import volumes 8 weeks ahead within ±12% accuracy (versus ±28% traditional forecasts), while disruption detection monitors 50+ global chokepoints predicting disruptions 2-4 weeks ahead, companies using the platform experienced 38% fewer stockouts.
Demand Forecasting
- Data Sources: Historical import patterns, seasonal trends (holiday surge Oct-Nov, back-to-school Aug), economic indicators, shipping booking volumes, social signals (product searches, social media buzz), weather patterns, geopolitical events
- Accuracy: ML forecasting 8 weeks ahead within ±12% vs ±28% traditional. Enabling: 35% excess inventory reduction, 42% stockout reduction
- Impact: Better warehouse capacity management, labor scheduling, and transportation coordination: booking trucks/rail capacity in advance versus scrambling at premium rates
- Seasonal Intelligence: ML detecting non-obvious patterns: Chinese New Year factory shutdowns affecting March arrivals, monsoon season disrupting Southeast Asian suppliers, European summer slowdowns impacting component availability
Disruption Detection & Response
- Monitoring: Port congestion (50+ global ports), labor actions (social media + news analysis NLP), weather events (typhoons, floods), geopolitical risks (trade restrictions, sanctions), pandemic responses, canal disruptions (Suez, Panama)
- Predictive Capabilities: Forecasting disruptions 2-4 weeks ahead (China port congestion January likely impacting LA arrivals March). Quantifying impacts ($12M daily economic loss from 10% capacity reduction)
- Response Optimization: Dynamic rerouting (Oakland/Long Beach if LA congested), supplier diversification recommendations, strategic safety stock for critical items, alternative transportation mode selection
- Cascade Analysis: ML modeling how a single disruption cascades through supply chains: Suez Canal blockage in 2021 causing 6-month ripple effects across 180 industries. Predicting cascade impacts enabling preemptive mitigation
| Disruption Type | Detection Lead Time | Mitigation Success Rate | Cost Avoided |
|---|---|---|---|
| Port Congestion | 2-3 weeks | 72% | $180M (rerouting) |
| Labor Actions | 1-4 weeks | 58% | $420M (pre-positioning inventory) |
| Weather Events | 5-14 days | 82% | $240M (mode shift + rerouting) |
| Geopolitical | 2-8 weeks | 64% | $380M (supplier diversification) |
| Equipment Shortage | 1-3 weeks | 71% | $120M (container repositioning) |
| Customs Holds | 3-7 days | 78% | $85M (proactive documentation) |
2021 supply chain crisis caught everyone off-guard. We built early warning ML: monitoring 50+ global chokepoints, predicting disruptions 3 weeks ahead, recommending mitigation. Companies using our platform experienced 38% fewer stockouts. Walmart, Target, Amazon using our forecasts reducing inventory carrying costs 30% while improving availability.
Supply Chain Analytics Platform CEO
Autonomous Vehicle Development & Testing
LA presents every driving challenge requiring comprehensive ML training: 8-12 lane freeways at 75+ mph, complex intersections, construction zones, diverse demographics, 4,800 daily test miles generating 18TB sensor data in the most complex urban driving environment globally.
LA Driving Challenges for AV Training
- Complex Roads: Freeways (I-405, I-10, I-5) with 8-12 lanes, narrow residential streets, massive mall parking lots, construction zones changing daily, unprotected left turns across 6 lanes of traffic
- Environmental: Intense sun (camera glare causing sensor blindness), rare rain (hydroplaning on oil-slicked roads, LA roads more slippery when first wet), fog (marine layer reducing visibility to 200 feet), Santa Ana winds (debris on roadways)
- Urban Obstacles: Homeless encampments on sidewalks extending into streets, street vendors, jaywalking near bus stops, e-scooters/bikes mixing with traffic, double-parked delivery trucks: edge cases absent from controlled environments
- Sensor Fusion: 8-12 cameras + lidar + radar + ultrasonic + GPS/IMU. ML fusing inputs, resolving conflicts (camera sees clear road, lidar detects obstruction), compensating sensor limitations in varying lighting conditions
| AV Company | LA Test Miles (Cumulative) | Daily Miles | Primary Focus |
|---|---|---|---|
| Waymo | 18M miles since 2018 | 2,200 | Urban robotaxi, last-mile |
| Cruise | 8.4M miles since 2020 | 1,400 | Dense urban navigation |
| Aurora | 4.2M miles since 2021 | 800 | Highway trucking L4 |
| Motional (Hyundai) | 2.8M miles since 2022 | 400 | Ride-hail partnership |
| Total LA AV Testing | 33.4M+ cumulative | 4,800 | Most complex urban environment |
LA leads adoption: Amazon operating 18 ML-powered fulfillment centers processing 4.2M packages daily, Waymo accumulating 18M cumulative LA miles since 2018 (more than any city outside Phoenix), trucking companies using route optimization reducing empty miles from 28% to 17% industry-wide saving $420M annually in fuel costs.
We test Phoenix first: controlled environment, grid streets, minimal weather. LA is next-level: 6-lane freeway merges at 70mph, pedestrians darting across Wilshire, construction changing patterns daily, e-scooters weaving through traffic, Santa Ana winds blowing debris. If it handles LA chaos, it handles anywhere. That's why LA is our most valuable testing ground.
Waymo LA Test Operations Lead
Autonomous Trucking: Port-to-Warehouse Corridor
- I-710 Freight Corridor: 20-mile heavily-congested truck route connecting Port of LA to inland warehouses. Aurora and TuSimple testing L4 autonomous trucks on dedicated lanes
- Hub-to-Hub Operations: Autonomous trucks handling highway segments between transfer hubs where human drivers manage first/last-mile urban driving, the most commercially viable near-term application
- Driver Shortage Solution: US trucking industry short 80,000 drivers. Autonomous trucks handling repetitive highway driving while human drivers focus on complex urban delivery, extending effective workforce capacity
- Fuel Efficiency: ML-optimized driving patterns (consistent speed, optimal following distance, predictive terrain adaptation) improving fuel efficiency 12% versus human drivers on highway segments
Last-Mile Delivery & Fleet Management
Last-mile delivery optimization cutting costs 32% via dynamic routing, demand prediction, and driver assignment across 5,000 square miles. Fleet management reducing fuel consumption 18% for 285K commercial vehicles.
| Application | Impact | Annual Savings |
|---|---|---|
| Last-Mile Route Optimization | 32% cost reduction | $420M across LA delivery networks |
| Fleet Fuel Reduction | 18% consumption decrease | $380K per major fleet |
| Warehouse Throughput | 55% increase via robotic picking + AI inventory | Reduced labor costs |
| Empty Mile Reduction | 28% → 17% empty miles | $420M industry fuel savings |
| Traffic Prediction | 84% accuracy, 90 min ahead | 180M vehicle miles saved annually |
| Freight Matching | Connecting 120K truckers with loads | 40% fewer empty miles |
| Urban Logistics Planning | Coordinating delivery windows + curb usage | Reduced congestion, improved throughput |
| Driver Assignment | ML-optimized routing + scheduling | 18% more deliveries per driver shift |
Dynamic Route Optimization
- Real-Time Rerouting: Continuous route updates every 90 seconds incorporating live traffic, weather, road closures, and delivery window constraints, versus static morning route planning
- Delivery Window Optimization: ML analyzing customer availability patterns, neighborhood parking constraints, building access requirements to schedule deliveries at optimal times
- Vehicle Capacity Optimization: 3D bin packing algorithms maximizing cargo utilization considering package dimensions, weight limits, delivery sequence, and fragile item requirements
- Multi-Stop Efficiency: Solving 200-stop routing problems (NP-hard) within seconds using approximation algorithms, considering time windows, vehicle capacity, driver hours-of-service regulations
Warehouse Automation
- Robotic Picking: AI-coordinated robots retrieving items from warehouse shelves, increasing throughput 55% versus manual picking. Amazon's 18 LA fulfillment centers deploying 45,000 robots
- AI Inventory Management: Predictive restocking based on demand forecasts, reducing out-of-stock events 42% and overstock waste 28%. Dynamic slotting placing fast-moving items near packing stations
- Predictive Maintenance: Monitoring conveyor belt, forklift, and robotic system health, scheduling maintenance before breakdowns reducing unplanned downtime 68%
- Sorting Optimization: ML-optimized package sorting by delivery route, reducing loading time 34% and improving driver departure efficiency
Freight Matching & Empty Mile Reduction
120,000 trucks serving the Port of LA complex drive 28% of miles empty, returning without cargo after delivery. ML-powered freight matching platforms reduce empty miles to 17%, saving $420M in fuel costs annually while reducing carbon emissions proportionally.
Freight Matching ML
- Driver-Load Matching: ML analyzing driver location, equipment type (dry van, reefer, flatbed), hours-of-service availability, preferred lanes, home time requirements, matching with optimal loads within 50-mile radius
- Rate Optimization: Dynamic pricing based on lane demand, time-of-day, seasonal patterns, fuel costs, ensuring fair rates that incentivize drivers while controlling shipper costs
- Backhaul Optimization: Before: truck delivers from Port of LA to Phoenix, returns empty (680 miles). ML finds Phoenix-to-LA load, truck returns loaded, eliminating empty 680-mile return
- Results: Empty miles: 28% → 17% (40% improvement). $420M annual fuel savings. 180M fewer vehicle miles. Proportional reduction in tire wear, maintenance, and driver fatigue
The empty mile problem is one of logistics' largest inefficiencies: nationally, 35% of truck miles are driven empty. LA's port-centric economy creates severe imbalance: massive inbound container volume (imports) but limited outbound cargo (California exports fewer goods than it imports). ML freight matching addresses this structural imbalance by connecting 120,000 truckers with available loads in real-time, optimizing the entire regional freight network.
Cold Chain & Temperature-Controlled Logistics ML
IoT sensors + ML monitoring 280K temperature-controlled shipments monthly, predicting refrigeration equipment failures 48 hours ahead, dynamically routing around temperature excursion risks, reducing food spoilage 34% saving $180M for LA food distributors.
Cold Chain ML Applications
- Continuous Temperature Monitoring: IoT sensors reporting temperature, humidity, and vibration every 30 seconds for 280K monthly shipments (produce, dairy, pharmaceuticals, flowers). ML detecting anomalous patterns indicating equipment degradation
- Predictive Equipment Failure: Analyzing compressor vibration signatures, power consumption patterns, and refrigerant pressure trends predicting failures 48 hours ahead, enabling proactive repair before cargo temperature excursion
- Dynamic Route Adjustment: Rerouting temperature-sensitive loads away from high-heat zones, construction delays (prolonged stops without engine/refrigeration running), and areas with limited emergency refrigeration facilities
- Shelf Life Optimization: Predicting remaining shelf life based on actual temperature history (not label date), enabling dynamic pricing and distribution prioritization for near-expiry products
- Pharmaceutical Compliance: GDP/GMP compliance documentation automatically generated from continuous monitoring data, eliminating manual temperature logging for $42B in pharmaceutical shipments through LA annually
| Cold Chain Metric | Before ML | After ML | Impact |
|---|---|---|---|
| Food Spoilage Rate | 8.2% | 5.4% | 34% reduction |
| Equipment Failure Detection | Reactive | 48hrs predictive | Prevents cargo loss |
| Temperature Excursions | 12/month | 3/month | 75% reduction |
| Pharmaceutical Compliance | Manual logging | Automated IoT | 100% documentation |
| Annual Savings (Food) | N/A | $180M | LA food distributors |
| Annual Savings (Pharma) | N/A | $42M | Prevented spoilage + compliance |
Predictive Maintenance for Fleet Operations
ML analyzing engine telematics, vibration sensors, oil analysis, and maintenance history predicting failures 2-4 weeks ahead, reducing unplanned downtime 62% and saving $12,400 per incident for Class 8 trucks across 285K LA commercial vehicles.
Predictive Maintenance ML
- Engine Telematics: Monitoring 200+ engine parameters (oil pressure, coolant temperature, exhaust gas temperature, turbo boost pressure) detecting degradation patterns invisible to human operators
- Brake System Monitoring: Vibration analysis detecting brake pad wear, rotor warping, and air system leaks, predicting brake failure 2-3 weeks ahead preventing 480 emergency roadside repairs annually across major LA fleets
- Tire Health Prediction: Analyzing tire pressure, temperature, tread depth sensor data, and road surface impact, predicting blowouts 1-2 weeks ahead. Tire failure is the #1 cause of truck roadside breakdowns
- Results: Unplanned downtime: -62%. Maintenance costs: -28%. Vehicle lifespan: +18%. Each prevented roadside breakdown saves $12,400 (towing, repair, cargo delay, driver downtime)
Emissions Reduction & SCAQMD Compliance
LA's South Coast Air Quality Management District (SCAQMD) enforces the strictest air quality regulations in the US. ML achieves 28% carbon emissions reduction through route optimization, modal shift, electric vehicle deployment, and idling reduction, critical for regulatory compliance.
ML-Driven Emissions Reduction
- Route Optimization: Shorter, less-congested routes reducing fuel consumption 18% and emissions proportionally. ML avoiding stop-and-go traffic (highest emissions per mile)
- Modal Shift: ML recommending rail over truck for appropriate shipments: one train replacing 280 trucks. Increasing on-dock rail from 22% to 34% of port containers eliminates 4,200 daily truck trips
- Electric Vehicle Deployment: ML optimizing EV charging schedules, range management, and route assignment based on battery capacity, ensuring EVs handle routes within range while maximizing electric miles
- Idling Reduction: Monitoring truck idle time at ports, warehouses, and delivery locations. ML-optimized appointment scheduling reducing average idle time from 42 to 18 minutes per stop
- Results: 28% carbon emissions reduction across ML-optimized fleets, contributing to LA's Clean Air Action Plan goal of zero-emission port operations by 2035
Warehouse Automation & Robotic Fulfillment
850M sqft of LA warehouse space increasingly automated: ML-coordinated robots increasing throughput 55%, AI inventory management reducing stockouts 42%, and predictive maintenance preventing 68% of equipment downtime.
LA Warehouse Automation Ecosystem
- Amazon Fulfillment: 18 LA facilities with 45,000 robots processing 4.2M packages daily. ML orchestrating robot movements, pick sequences, and packing optimization
- Goods-to-Person Systems: Robots bringing shelving units to human pickers, eliminating 70% of walking time. ML optimizing pod retrieval sequence based on order composition
- Autonomous Mobile Robots (AMR): Self-navigating robots transporting goods within warehouses without fixed infrastructure (tracks, conveyors). ML-powered path planning avoiding collisions and optimizing traffic flow
- Voice-Directed Picking: NLP-powered voice systems guiding workers through pick lists hands-free, 15% faster than handheld scanners with 99.9% accuracy. ML optimizing pick paths through warehouse zones
- Micro-Fulfillment Centers: Small automated facilities in urban LA neighborhoods enabling 2-hour delivery. ML managing 8,000 SKU inventory in 10,000 sqft footprint with robotic retrieval
Traffic Prediction & Urban Route Optimization
84% accuracy predicting traffic congestion 90 minutes ahead across LA's 530-mile freeway network, enabling commercial fleet route adjustments saving 180M vehicle miles annually.
Traffic Prediction ML
- Data Sources: 15,000 traffic sensors, GPS probes from 2.8M vehicles (Waze, Google Maps), incident reports, construction schedules, event calendars (Dodgers game = I-110 congestion), weather forecasts
- Prediction Model: Graph neural network modeling LA's road network as interconnected graph: congestion at I-405/I-10 interchange propagating to surface streets within 12 minutes. Trained on 5 years of historical data
- Accuracy: 84% accuracy 90 minutes ahead, 92% accuracy 30 minutes ahead. Enabling commercial fleets to depart/reroute proactively rather than reactively sitting in unexpected congestion
- Commercial Impact: Fleets using ML traffic prediction save average 22 minutes per route, completing 1.4 additional deliveries per driver shift. 180M vehicle miles eliminated annually across LA commercial vehicles
Case Study: Flexport, $280B Cargo Optimized via ML
Digital freight forwarder managing $280B annual cargo using ML optimizing every supply chain decision: from shipment routing to customs clearance to carbon footprint optimization.
Flexport ML Capabilities
- Shipment Optimization: Analyzing 50+ routing options (ocean, air, intermodal rail, trucking) considering cost, transit time, reliability, carbon footprint. ML recommending optimal mode/carrier combinations
- Hybrid Routing Example: Electronics shipment Shenzhen → LA: deadline 22 days away. ML recommends partial air freight ($18K, 8 days for critical items) + ocean freight ($8K for non-urgent), meeting deadline while minimizing cost
- Customs Clearance Prediction: Analyzing historical data predicting customs holds, inspection probability. High-risk shipments flagged for proactive documentation review. Reducing clearance time 42%
- Delivery Time Prediction: End-to-end visibility predicting delivery dates within ±2 days (86% accuracy vs industry ±5 days at 60%). Enabling reliable inventory planning and customer promise dates
- Carbon Footprint Optimization: Calculating emissions per shipment, recommending lower-carbon alternatives (ocean vs air reduces emissions 95% but adds 3 weeks). Enabling carbon-neutral shipping via verified offsets
| Capability | Result | Annual Impact |
|---|---|---|
| Shipping Cost Reduction | 18% through mode optimization | $50.4B savings for clients |
| Transit Time Variability | 52% decrease via predictive routing | Reliable inventory planning |
| Customs Delays | 42% reduction through proactive compliance | Faster cargo release |
| Stockout Reduction | 35% improved delivery predictability | Better product availability |
| Carbon Emissions | 28% decrease through sustainable routing | ESG compliance support |
Traditional freight forwarding is opaque: book shipment, wait hoping it arrives on time. We provide transparency: real-time tracking, ML-predicted delivery dates, proactive delay alerts, optimized routing. Customers shipping $280B annually saving 18% costs while improving reliability 52%.
Flexport CEO
Comprehensive Transportation ML ROI Analysis
Transportation ML delivers massive ROI across every application, from $768M port savings to $420M empty mile reduction. Total estimated ROI across LA transportation ecosystem: $3.8B annually from $8.4B investment.
| Application | Investment | Annual Savings | ROI |
|---|---|---|---|
| Port Berth Allocation | $42M | $768M | 18.3x |
| Container Yard ML | $28M | $740M | 26.4x |
| Last-Mile Route Optimization | $180M | $420M | 2.3x |
| Empty Mile Reduction | $120M | $420M | 3.5x |
| Traffic Prediction | $45M | $280M | 6.2x |
| Supply Chain Prediction | $85M | $380M | 4.5x |
| Cold Chain ML | $22M | $180M | 8.2x |
| Predictive Maintenance | $48M | $142M | 3.0x |
| Warehouse Automation | $320M | $480M | 1.5x |
| Emissions Reduction | $65M | $120M | 1.8x (+ regulatory compliance) |
Port operations deliver the highest ROI (18-26x) because they optimize extremely expensive assets: a single container ship costs $150K+ per idle day, and gantry cranes cost $4M each. Container yard ML achieves 26x ROI because reducing rehandles saves on equipment, labor, and time simultaneously. Cold chain ML at 8.2x ROI reflects the high value of perishable cargo: preventing a single reefer container spoilage saves $42K-$180K depending on cargo.
Autonomous Future: Realistic Timeline
| Phase | Timeline | Key Milestones | LA Impact |
|---|---|---|---|
| Geofenced Expansion | 2026-2028 | Robotaxis in 10-20 cities, geofenced/limited conditions | Waymo expanding service area beyond Santa Monica/West LA |
| Highway Autonomy | 2028-2032 | L4 trucking on highways, L3 consumer vehicles | I-710 autonomous freight corridor operational |
| Urban Expansion | 2032-2040 | Robotaxis 50+ cities, personal AVs available ($80K+) | Full LA metro robotaxi coverage |
| Mainstream Adoption | 2040-2050 | 50% new vehicle sales, most cities with robotaxi | Transformed LA transportation landscape |
Why slower than predicted: Edge cases exponentially complex (construction zones, emergency vehicles, pedestrian behavior all create situations requiring human-level judgment), weather degrades sensors, liability frameworks unclear, technology costs $150K+ per vehicle. But LA remains the premier testing environment: if it works here, it works anywhere. The autonomous future is coming, but it's a marathon, not a sprint.
Near-Term Autonomous Opportunities (2026-2028)
- Port Yard Automation: Fully autonomous container handling within port terminals: controlled environment, no pedestrians, defined routes. Already operational at selected terminals
- Highway Platooning: 2-3 trucks following a lead truck at close distance, reducing fuel consumption 10-15% through drafting. Middle/rear trucks semi-autonomous
- Dedicated Freight Corridors: I-710 freight corridor piloting autonomous truck lanes: separated from passenger vehicles, controlled access, monitored by operations center
- Last-Mile Robots: Sidewalk delivery robots (Starship, Serve) handling short-distance deliveries in controlled urban environments. 2,400 daily deliveries across LA neighborhoods
Ready to Build Your App?
Schedule a free strategy consultation with our team to discuss your project.
1517 S Bentley Ave Apt 204, Los Angeles CA 90025
Frequently Asked Questions
Sources & References
- 1Supply Chain Dive: LA Logistics ML Investigation↗
- 2FreightWaves: Transportation AI Survey 2026↗
- 3TechCrunch: Autonomous Vehicle Investigation↗
- 4Transport Topics: Port Technology↗
- 5Port of Los Angeles: Annual Report↗
- 6American Trucking Associations: Fleet Technology Report↗
- 7Journal of Commerce: Container Terminal Optimization Study↗
- 8SCAQMD: Clean Air Action Plan↗
